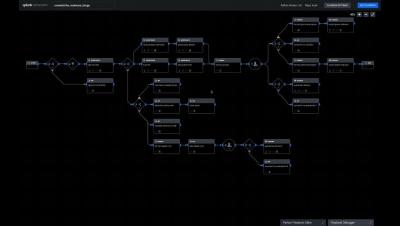
As government agencies accelerate migrating their operations to the cloud, they need to adhere to strict compliance and security standards. The Federal Risk and Authorization Management Program (FedRAMP) provides the standard that these agencies—and their private-sector partners—must meet to work and manage federal data safely in the cloud.
When performing critical security investigations and threat hunts using Elastic Security, the Timeline feature is always by your side as a workspace for investigations and threat hunting. Drilling down into an event is as simple as dragging and dropping to create the query you need to investigate an alert or event.
According to the American Management Association, nearly half of employers monitor their employees’ digital activity on company-owned devices to some degree. Some of these employers manually read employees’ emails and track their activity. But the vast majority use software for monitoring computers, which is far more efficient. The right software can help you keep track of what your employees are doing during work hours, regardless of whether they are in the office or working remotely.
Since 2018, Watchdog has provided automatic, machine learning-based anomaly detection to notify you of performance issues in your applications. Earlier this year, Watchdog started grouping APM anomalies across your services, allowing you to better understand the scope of the issue.
For today’s busy sysadmin, systems health and performance monitoring tools like Microsoft’s SCOM (Systems Center Operations Manager) and the open-source Nagios are invaluable. They enable at-a-glance monitoring of large numbers of servers throughout a network, which is doubly critical in case of a widely geographically dispersed network setup such as in a WAN or MAN. Though they broadly achieve the same goals, SCOM and Nagios come at it from quite different directions.
Kubernetes continues to be a popular platform for deploying containerized applications, but securing Kubernetes environments as you scale up is challenging. Each new container increases your application’s attack surface, or the number of potential entry points for unauthorized access. Without complete visibility into every managed container and application request, you can easily overlook gaps in your application’s security as well as malicious activity.
If you are running a user-facing web application, you likely implement some form of authentication flow to allow users to log in securely. You may even use multiple systems and methods for different purposes or separate groups of users. For example, employees might use OAuth-based authentication managed by a company-provided Google account to log in to internal services while customers can use a username and password system or their own Google credentials.
When we set out to create a cloud-based tool for configuration monitoring, we used the tools we knew and wrote UpGuard using JRuby. For our application, JRuby had many good qualities: getting started only required a one line install, the agent only needed to talk out on port 443, and it was platform agnostic. Using JRuby we demonstrated the value of system visibility, attracted our first cohort of customers, and raised the funds to expand UpGuard.